25 Web Dev & QA Testing Statistics Every Developer Should Know [2022]
Trends move quickly in the web development and QA testing space. These trends can help predict where the QA and testing industry is headed. Development teams can adapt emerging best practices and methodologies while gaining a better understanding of the challenges they face throughout the development cycle.
General Web Dev & Design Statistics
The state of web development and web design remains consumer-focused. Data suggests that customers prefer websites and software with greater usability. As such, web developers, designers, and testers are encouraged to focus on creating a great user experience — images, graphics, and videos are especially important. Fast loading times are also crucial to a website’s success.
1. 48% of people look at a website’s design to gauge a business’ credibility. (Blue Corona)
Good website design is hard to ignore, and audiences use it to decide if they want to do business with a company or not. As such, a user-friendly and functional website is critical in attracting new clients. Development teams around the world should keep this in mind if they want to make a great first impression using the sites they create.
2. 250,000+ websites are created every day. (Siteefy)
Thousands of websites are created daily, but not all of these stay active for a long time. Some of them vanish from the internet quickly, while others are created to compensate for the disappearing ones. For a business to stand apart from these websites, it must ensure good functionality and work to keep its presence online.
3. Retailers lose $2.6 billion each year due to slow-loading websites. (Inside Design)
People hate slow-loading websites. Period. Even with excellent web designs, businesses may lose a huge chunk of their sales potential because of those extra seconds in loading time. Slow loading times are often caused by network congestion, bandwidth throttling, and content filtering, among others. Properly testing the site and following page speed best practices are important to solving these issues.
4. Photos and images (40%), color (39%), and videos (21%) are the top visual elements people appreciate about a website. (TopDesignFirms)
Consumers shy away from websites with poor design and speed, but they appreciate websites that have excellent images, colors, and videos. Consistent and on-brand design without bugs or glitches is key to retaining their attention.
5. 60% of customers say website usability is important for them in an online shop. (Statista)
Improving the usability of your website or shop can attract more customers. You can do this by making the site as easy to use as possible through visual hierarchy, consistency, and colors. Usability tests are important for this, along with other types of tests.
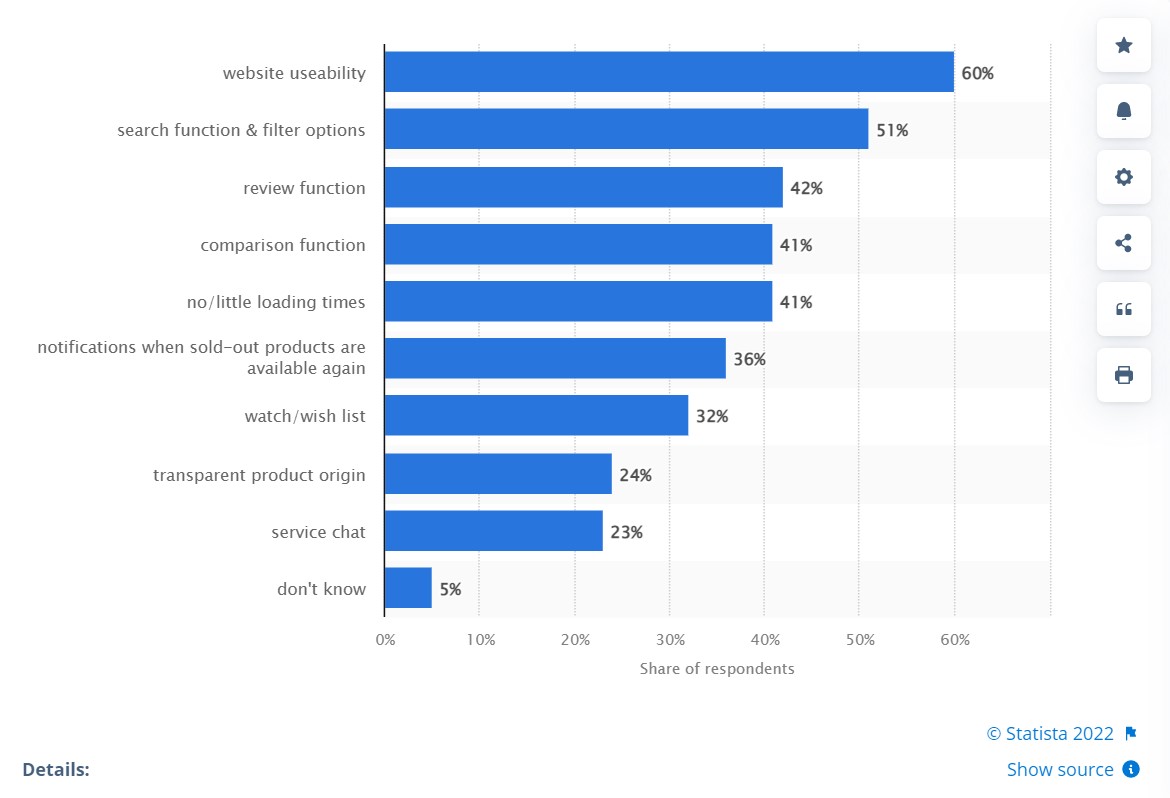
Image Source: https://www.statista.com/forecasts/961919/important-design-characteristics-for-online-shops-for-us-consumers
Bugs & Testing Stats You Should Know
The testing market is expected to grow into 2030 as cybersecurity and risk compliance underpin the demand for various forms of testing. Websites and mobile apps are particularly in need of fast, efficient, and effective testing.
Meanwhile, the QA teams and testers themselves also face challenges. These challenges are related to the cost, speed, and scalability of their testing efforts. Generally, more and more companies are seeking to replace their testing efforts with automated procedures.
6. The software testing market is expected to grow by more than 6%. (GMI)
In 2021, the software testing market crossed above $40 billion. Experts expect it to have a CAGR of over 6% from 2022 to 2030.
7. 79% of users note bugs in their software and websites. (PractiTest)
Companies use bug reports as the most common type of test documentation. Around 79% of end users noted they encountered bugs in 2019.
8. 69% of companies say developers should be able to write secure code. (GitHub)
Security is a major concern among developers. Around 69% of companies require developers to write secure code. However, 68% believe that lower than 50% of developers can’t spot vulnerable parts of code. These vulnerabilities are usually found later on.
9. Cybersecurity spending is expected to hit $133.7 billion in 2022. (University of North Dakota)
Data breaches and the constant threat of security systems failure have increased demand for cybersecurity and risk compliance. Websites and software programs must be tested frequently against new threats. Mobile apps are also an important field for the testing industry, as the mobile app market is expected to reach $407.31 billion by 2026. These demands underpin the market for testing services.
Manual vs. Automated Testing Statistics Dev Teams Should Know
Development teams face many challenges in terms of implementing the testing cycle. They use a variety of approaches with varying levels of success. Other issues include implementing cost- and time-effective approaches. This section revolves around manual and automated testing statistics, along with the tools developers often use.
10. 77% of testers work on web testing. (The QA Lead)
Most testing happens during the web development cycle. However, the same data suggests that 74% of testers do other work apart from testing — up to 57% also do scripting, automation, and data management tests.
11. 48% of QA teams have between one to five members. (The QA Lead)
Nearly 50% of companies have QA teams with one to five members. Meanwhile, 24% of testing teams have six to 15 testers. QA and quality control teams collaborate. Despite having different tasks, the two teams are tightly connected.
12. 35% of companies use non-testers in their testing process. (PractiTest)
Around 35% of businesses involve non-testers in their testing cycle. However, 55% of companies still use testers for the majority of their testing needs.
13. High-performing products have 200x more frequent code deployments. (Puppet)
According to Puppet’s 2016 State of DevOps Report, high-performing product teams perform better than others because they deploy 200 times more frequently. They also have 2,555 times faster lead times and recover 24 times faster, with three times lower change failure rates.
14. 44% of testing teams find project participation “very challenging”. (PractiTest)
Testing teams find it challenging to participate in their company’s projects earlier in the process. Meanwhile, around 43% cited handling data and test environments as “very challenging.” Around 65% of their QA tasks revolve around requirements analysis, while 55% are retrospective meetings on projects.
15. 23% of companies’ annual IT budgets are allocated to QA and testing. (Statista)
As of 2019, around 23% of companies' budgets go to QA and testing. Although this seems a huge-enough allocation, the figure has been decreasing since 2015, when it hit a high of 35%. As the biggest challenge associated with QA tests is cost, it’s unsurprising that companies are trying to lower QA expenses.
16. Manual testing (35%) is the most time-consuming activity in a testing cycle. (Perfecto.io)
Around 35% of the testing cycle time is spent on manual testing. Test failure analysis is the second-most time-consuming task at 22%, followed by test environment setup (17%) and advanced script creation (14%).
17. 87% of companies use the agile methodology as a development testing model. (PractiTest)
The most common development testing approach is agile or agile-like methodology. It’s followed by DevOps at 36%.
18. 82% of companies use exploratory testing. (PractiTest)
A vast majority of companies use exploratory testing as a testing methodology, while only 61% use conventional script-based inspection.
19. 26% of companies use automated testing to replace 50% of their manual testing efforts. (PractiTest)
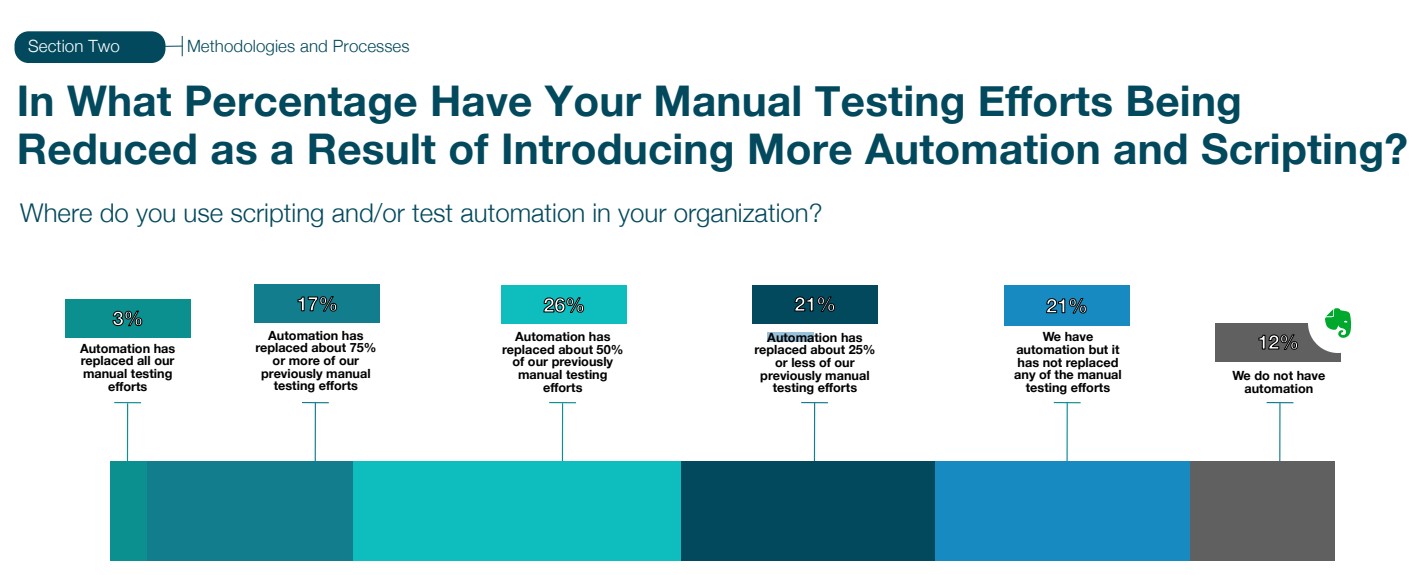
Image Source: https://www.practitest.com/resource/state-of-testing-report-2021/
More companies have used automated testing to replace 50% of their manual testing efforts. Around 21% say they use automation to replace 25% of their efforts, while another 21% say they have automation but it hasn’t replaced their manual tests. Only 12% do not have automation, and only 3% say automation has replaced all of their manual testing efforts.
20. Automated testing (30%) is the top priority in the software testing space. (Perfect.io)
Companies have automated testing as their top priority in the software testing space. It’s followed by:
- 15% - improving test automation coverage
- 14% - executing tests faster
- 12% - reducing regression time testing
Other priorities include transitioning testing in the cloud, integrating tests into CI/CD pipelines, and reducing the cost of test execution.
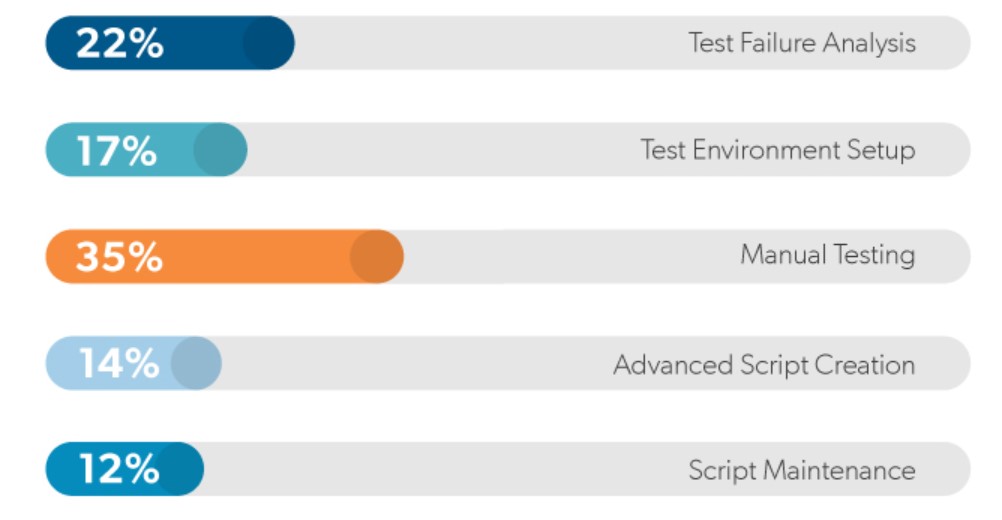
Image Source: https://www.perfecto.io/resources/state-test-automation#success
21. Distributed untested code (60%) is the most common production bug. (HackerRank)
Around 60% of production bugs appear in the form of distributed untested code. Aside from testing software bugs, QA testers also handle database testing. As such, the second most common bug is an erased database, accounting for 10% of all issues they find.
22. 58% of companies use some form of visual testing. (BrowserStack)
Around 58% of companies use visual testing in their QA cycle. More companies are embracing visual testing as a scalable and practical approach to front-end testing. In the past two years, visual testing adoption has accelerated — the trend is expected to continue into the foreseeable future.
23. 47% of testers use the following tools for QA and testing. (PractiTest)
ALM, Team Foundation Server, PractiTest, or Xray are used by nearly 50% of testers.
24. In addition, 44% of developers use issue tracker tools regularly. (Jet Brains)
On top of that, 10% of developers use tools to review code, including Collaborator, CodeScene, and Review Assistant.
25. 68% of developers use Jira. (Jet Brains)
Around 68% of developers use Jira as an issue tracker tool. The second most-used tracker is GitHub Issues at 26%.
Conclusion
As the world continues to adapt technologies and websites in their everyday lives, the need for faster and more secure development approaches is bigger than ever. Development and QA teams continue to work toward these goals and address existing industry challenges.
Sources:
Blue Corona | Siteefy | Inside Design | TopDesignFirms | Statista | GMI | PractiTest | GitLab | University of North Dakota | The QA Lead | PractiTest | Puppet | Statista | Perfecto.io | HackerRank | BrowserStack | Jet Brains |